
OVERVIEW
American firms make goods with fewer emissions than most countries in the world. We call this a carbon advantage. With the right policies, America can leverage this carbon advantage to enhance the competitiveness of U.S. businesses, bring manufacturing jobs back to the U.S., and boost climate ambition around the world.

WHY IT MATTERS

Enhance the competitiveness of U.S. businesses
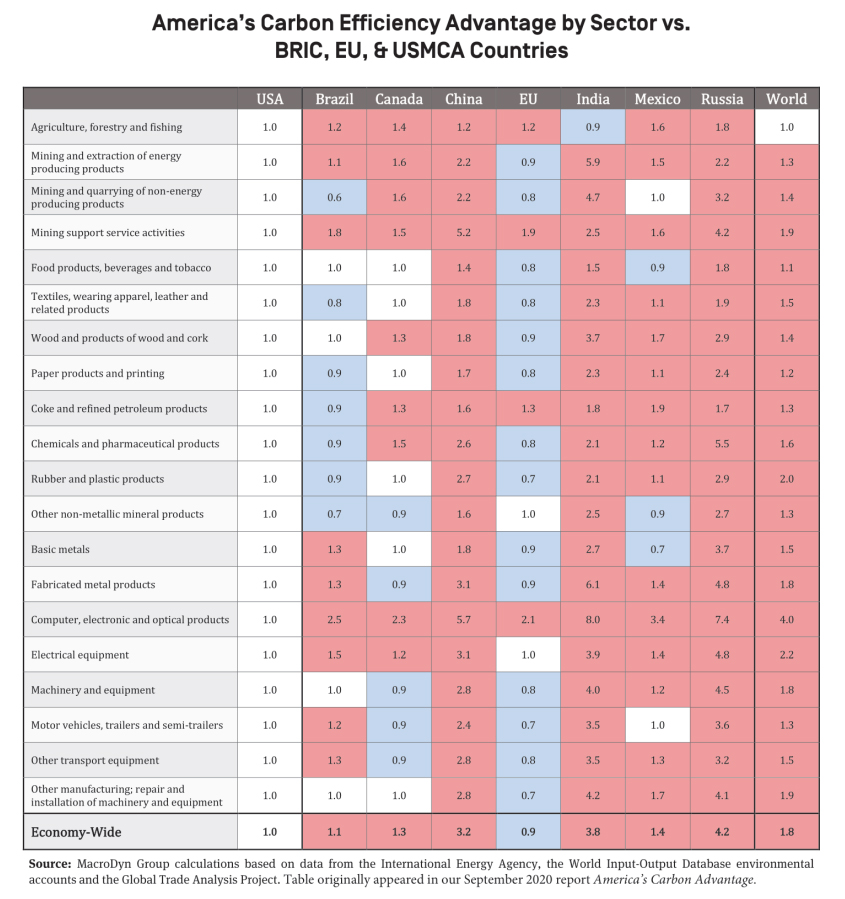
Goods manufactured in the U.S. are 44% more carbon-efficient than the world average. For example, the U.S. steel industry is 75% – 320% more carbon efficient than global producers, depending on the product segment. U.S. chemicals manufacturers are 10-40% more carbon efficient than the global average across five of the most common bulk chemicals. And U.S.-made thin film solar panels generate 90% less greenhouse gas emissions than the silicon-based modules that China specializes in. But today, U.S. manufacturers get no credit for producing goods with fewer emissions. A well-designed climate policy would level the playing field and encourage competition where more carbon-efficient firms win out.

Bring manufacturing jobs back to the U.S.
The more the global economy values lower-carbon production, the more U.S.-based businesses stand to win. And the more global supply can be met from U.S.-production, the more global emissions stand to fall. With the right policies in place, we can level the playing field and in doing so see U.S. manufacturers and workers come out ahead.

Boost climate ambition around the world
The U.S., as the world’s largest importer, remains the most important market for countries around the world. At the same time, 75% of the goods we import are from less carbon-efficient countries. With the right policies in place, exporters to the U.S. will increasingly be faced with a choice: reduce emissions or lose market share to cleaner alternatives in the world’s most important consumer market.
To better understand these dynamics, the Council commissioned a model that tracks the carbon embedded in trade and calculates emissions from 36 economic sectors across 64 individual countries. Weighted by economic output, the model reveals the relative carbon efficiency of production, by sector, across countries.

Several studies echo our analysis and underscore the U.S. proficiency in carbon-efficient manufacturing.
- The OECD’s Trade in Embodied CO2 (TeCO2) database offers comprehensive insights into carbon emissions. This analysis duplicates the pioneering analysis underpinning the Council’s work and offers additional parameters for country- and sector-level consumption and production patterns.
- A 2019 analysis by the U.S. Department of Energy’s National Energy Technology Laboratory affirms that U.S. liquefied natural gas exports for power production in European and Asian markets maintain a carbon advantage over regional alternatives.
- A 2014 study from Northwestern University and the U.S. Department of Energy’s Argonne National Laboratory found that solar panels made in China have a larger carbon footprint and are likely to use substantially more energy during manufacturing than those made in Europe or the U.S.
- A 2019 report by the International Energy Agency highlights how the switch from coal to gas in the U.S. power sector has contributed to America’s carbon advantage in electricity generation.
- The UN’s FAOSTAT database contains food and agriculture data for over 245 countries and territories. Its emissions intensity data underscores that U.S. production of commodities like beef boasts a notably lower carbon intensity than other major exporters.